Diurnal Variation of Serum Alanine Transaminase Activity in Chronic Liver Disease
 |
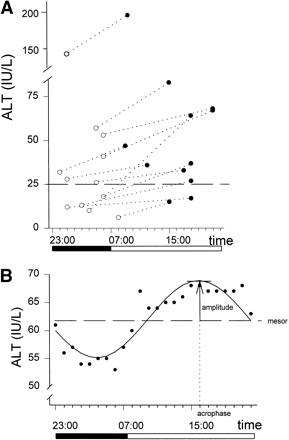
Fig. 1. (A) Lowest (open circles) and highest (closed circles) values of hourly ALT (IU/L) in 12 patients with cirrhosis and time of occurrence. Lights were off (solid bar) from 23:00 to 07:00 and on (open bar) the rest of the day. At our center the upper limit of normal ALT was 25 UI/L (dotted line). (B) Hourly values of ALT in a patient with cirrhosis. The graph shows the best fitting curve (R2 = 0.84) obtained by cosinor analysis and the parameters that define the rhythm: mesor (rhythm adjusted mean), amplitude (difference between peak value and mesor), and acrophase (time of peak). Cosinor analyses consist of fitting a set of cosine curves to the data. The best fitting curve is found by minimizing the sum of squares of differences between the actual measurements and the curve. The curve is defined by the function: Y = M + A cos ( |


